
Amazon AWS released CloudWatch Insights in 2018. You can use CloudWatch insights to
- search across log groups
- filter, parse and sort data
- perform mathematical operations (sum, avg, count, ,min, and max)
- aggregate log data
- graph log data
Aggregating Errors
Here is how for a log group you can find all log entries containing text: ‘error’, ‘Error’, ‘exception’ or ‘Exception’
filter @message like /(?i)(error|exception)/where (?i) is for case insensitivity.
Result
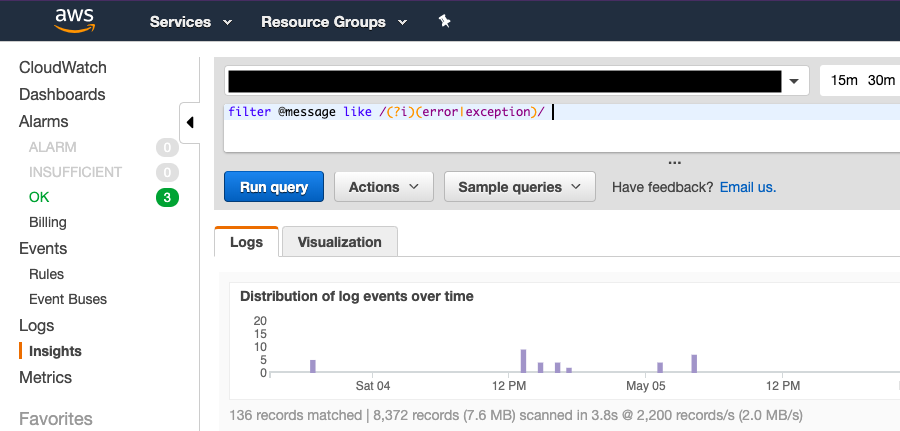
The result contains
- total number of results
- query time
- number of results scanned
- amount of log data scanned
- each matching log entry (not pictured)
- graph displaying when the entries occurred
A more detailed visualization can be seen by clicking on the ‘Visualization’ tab.
Error Aggregation
If you want to find all errors, group by error then count and sort by the most frequent error first, you can run the following
filter @message like /(?i)(error|exception)/ | stats count(*) as errorCount by @message | sort errorCount descPersisting Queries
You won’t want to be typing in that query every time you want to see the results. You can save the query to a dashboard by clicking on ‘Add to dashboard’.
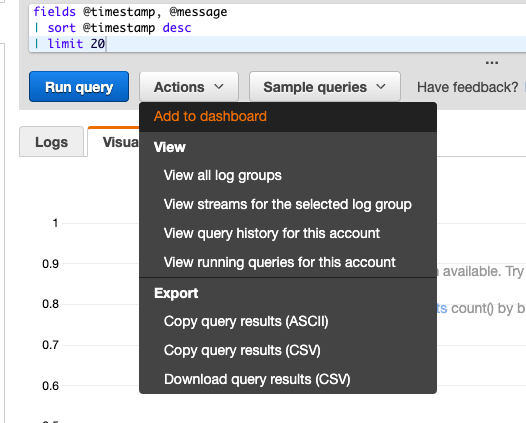
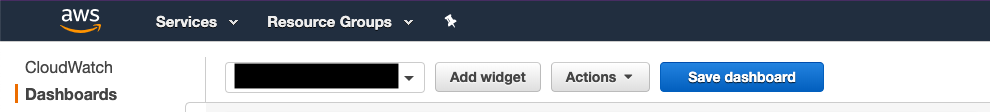
Importantly that query will not persist to the dashboard until you click the ‘Save dashboard’ button.
More Information
AWS CloudWatch Insights has a lot more functionality. For more details check out the AWS CloudWatch Insights docs.
